|
|

This strategy is helpful in studying ideas
that have to be compared based on their similarities and differences.
Making such comparisons is necessary for most, if not all, academic
subjects. It is important to write down or draw the relationships
because it is easier to understand relationships when they are
shown visually.
|
|
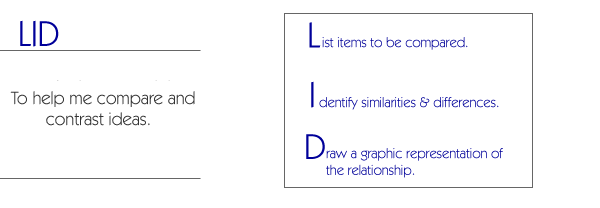
L
ist items to be compared.
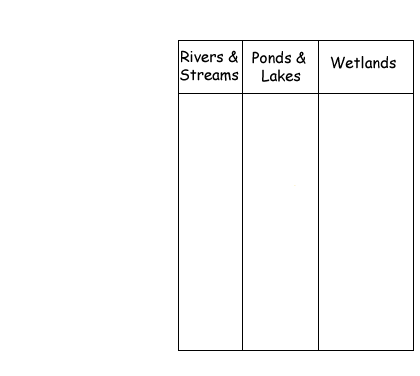
- Make a list of the ideas to be compared.
- Write each of these ideas at the top of a column.
- For example, if you were comparing the three
freshwater ecosystems for your science class, you would have three columns:
one for rivers and streams, another for ponds and lakes, and another
for wetlands.
|
 |
|
I
dentify similarities and differences.
- Use a systematic approach to identify factors
for comparing each of the items. These factors should be based on your
readings and lecture notes.
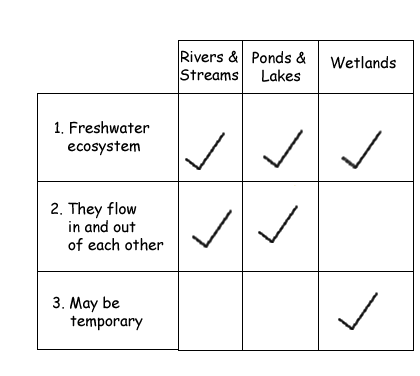
- Write one factor on each line. Then, go across
the columns and ask yourself if this factor applies to the item in a
particular column. If it does, put a check in the column. If it does
not, leave the column blank.
- Analyze the columns. If there is a check going
across all the columns, then this factor is a shared similarity of all
the items. If there is a check going across some of the columns, then
the factor is shared by those items listed at the top of the columns.
Those items without checks do not share the factor listed at the top.
Likewise, if items do not have checks, then they share the similarity.
- After you have constructed the listings, verbally
describe the similarities and differences among the items to yourself.
- For the example of the rivers and streams, ponds and
lakes, and wetlands, they all are similar on the first factor which
is freshwater ecosystem. The second factor (they flow in and out of
each other), applies to rivers and streams and ponds and lakes, but
not to wetlands so rivers and streams and ponds and lakes are similar
on this factor, but wetlands differ. The third factor (may be temporary)
applies only to wetlands so rivers and streams and ponds and lakes are
similar on this factor, but wetlands differ.
|
 |
D
raw a graphic representation of the relationship.
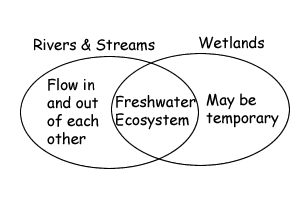
- If you are comparing two items, draw a Venn
diagram with two partially overlapping circles. Write the similarities
of the two items in the overlapping part of the circles and write the
differences in the parts of the circle that do not overlap.
- Color coding when writing similarities and differences
may also be helpful. You may want to write factors that are similar
in one color and factors that differ in another.
|
 |
|
|
|
|
 |


